Appendix 1: Technical information about drinking water supply in the eight local authorities
Local authorities: Planning to meet the forecast demand for drinking water.
The information in this Appendix is for those readers interested in technical detail about the supply of drinking water in the eight local authorities. It includes:
- factors that drive demand, such as population growth;
- a summary of our conclusions about aspects of each local authority's water supply systems that may affect their capacity to manage their drinking water, for example, whether they have access to enough source water and whether they are able to forecast demand accurately; and
- technical data, such as the number of water supply systems and populations served, the amount of water produced and consumed, and costs of supplying drinking water.
| Local authority | Tauranga City Council | Nelson City Council | Tasman District Council | Kapiti Coast District Council |
|---|---|---|---|---|
| Location | 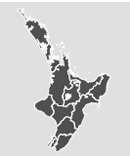 |
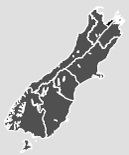 |
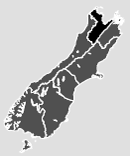 |
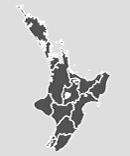 |
| Population (2006) | 103,632 | 42,888 | 44,625 | 46,200 |
| Population growth rate (2001-06) | +14.4% | +4.2% | +7.6% | +9.2% |
| Number of water supply systems | 1 | 1 | 16 | 4 |
| Access to water sources (security and quantity of water available) |
Existing supply secure but needs more to provide for future growth Uses surface water for supply |
Uses surface water for supply | Uses a mix of groundwater and surface water sources for supplies | Uses surface water and groundwater for supplies |
| Quality of drinking water (ability to comply with the drinking water standards) |
Currently ungraded Previously graded Aa but requires minor upgrades to comply with the latest drinking water standards |
Currently graded Ab Planning to improve distribution grading |
Currently ungraded and requires upgraded infrastructure (additional filtration and disinfection) to comply | Currently ungraded and requires upgraded infrastructure (installation of UV treatment) to comply |
| State of the distribution network | No specific reticulation or efficiency issues Has an active leakage management programme |
The pipeline between source and treatment facility is ageing and at risk of failure Trunk watermains and reservoirs need extensions and additions to meet growth demand Reticulation condition requires continuous monitoring and maintenance/ replacement |
Possible high leakage in some supplies No current leak detection programme but planning to develop |
Consumption levels tend to be high Possible high leakage in Otaki Ongoing leak detection programme but still to accurately quantify extent of leakage |
| Local authority | Opotiki District Council | Christchurch City Council | Central Otago District Council | South Taranaki District Council |
| Location | 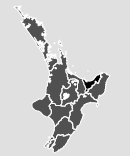 |
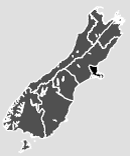 |
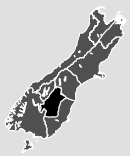 |
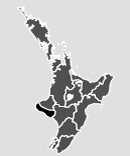 |
| Population (2006) | 8973 | 348,435 | 16,647 | 26,487 |
| Population growth rate (2001-06) | –1.5% | +8.6% | +16.4% | – 4.4% |
| Number of water supply systems | 3 | 9 | 9 | 13 |
| Access to water sources (security and quantity of water available) |
Uses surface water for supplies | Groundwater used for Christchurch City supply, and a mix of groundwater and surface water used for Banks Peninsula supplies | Uses mix of surface water and groundwater for supplies Possible pressure when resource consents for surface water takes are due for renewal because consumption is very high |
Uses surface water for supplies Pressure on supply from drought, and surface water in some catchments is at or near full allocation |
| Quality of drinking water (ability to comply with the drinking water standards) |
Currently ungraded and requires upgraded infrastructure (UV treatment) to comply | Currently graded Ba and Da for Christchurch City and Ee for Banks Peninsula supplies Requires upgraded infrastructure to comply in Banks Peninsula and may invest in new infrastructure to improve grades for Christchurch City Managing risk of contamination is critical because supply is untreated |
Currently ungraded and requires upgraded infrastructure (treatment plants) to comply | Currently ungraded and requires upgraded infrastructure (treatment plants) to comply |
| State of the distribution network | Possible high leakage, does not have an active leak detection programme but is planning to develop one | No specific reticulation or efficiency issues Has an active leakage management programme |
Consumption tends to be high High leakage possible in all supplies, started a leak detection programme but still to accurately quantify extent of leakage Current water supply systems are energy intensive Reticulation system for pumping water from source to reservoir produces very high pressure in some properties |
Consumption tends to be high Possible high leakage in all supplies, started a leak detection programme but still to accurately quantify extent of leakage Infrastructure upgrades are required to manage risk, increase resilience, and improve the efficiency of the systems |
| Local authority | Tauranga City Council | Nelson City Council | Tasman District Council | Kapiti Coast District Council |
|---|---|---|---|---|
| Capacity to forecast demand | Forecasting reasonably detailed and likely to be accurate |
Forecasting reasonably detailed and likely to be accurate |
Forecasting reasonably detailed and likely to be accurate |
Forecasting adequate but data could be improved |
| Planning for future demand |
Future demand cannot be met with existing water supply Investing in new supply to meet forecast future demand Uses universal water metering and charging plus a number of other initiatives to manage demand |
Future demand can be met with existing supply Uses universal water metering and charging to reduce demand |
Future demand cannot be met with existing supply Strategy to meet demand is based on supply augmentation Uses universal water metering and charging to reduce demand in all urban supplies, which is about 90% of the total number of water users |
Existing supply is generally sufficient to meet future demand now; but, in some parts of the district, by 2015/16, summer demand is projected to exceed the amount that can be legally taken under resource consents Has decided to increase supply Committed to reducing consumption and uses voluntary conservation to reduce demand |
| Attracting and retaining skill base (capability |
||||
| Expenditure on drinking water supply |
Water supply funded by user fees and charges LTCCP budgets $227,658,000 over the period 2009-19 on capital expenditure |
Water supply funded by user fees and charges LTCCP budgets $46,653,000m over the period 2009-19 on capital expenditure |
Water supply funded by targeted rates and user fees and charges LTCCP budgets $76,953,459 (inflated) over the period 2009-19 on capital expenditure |
Water supply funded by targeted rates LTCCP budgets $60,193,000 over the period 2009-19 on capital expenditure |
| Total annual drinking water supply rates and charges (2009/10) | $14,683,000 | $10,109,000 | $5,526,697 | $6,646,000 |
| Total annual drinking water supply production | 13,258,278m3 | 14,636,500m3 | 5,525,005m3 | 7,446,000m3 |
| Volumetric price of drinking water | $1.20 per m3 | $0.70 per m3 | $0.99 per m3 | $0.89 per m3 |
| Value of water supply assets (30 June 2009) |
$175,205,000 | $129,537,000 | $84,028,000 | $68,295,000 |
| Local authority | Opotiki District Council | Christchurch City Council | Central Otago District Council | South Taranaki District Council |
| Capacity to forecast demand | Forecasting limited |
Forecasting currently limited by incomplete data, but developing a demand-forecasting model |
Forecasting limited by incomplete data Particularly needs accurate water consumption data |
Forecasting limited by incomplete data Particularly needs accurate water consumption data |
| Planning for future demand |
Future demand in terms of quantity can be met with existing supply over the next 10 years Has universal metering and charging and developing other conservation measures |
Future demand can be met with existing water supply until about 2050 Few tools currently used for reducing demand Uses universal metering but charges only commercial and industrial consumers Currently preparing a water supply strategy for 2009-39 that includes more demand management tools |
Poor position to effectively manage future demand for water supply but has adopted the Central Otago Drinking Water Strategy 2007 which, if implemented, should improve the situation Currently has some tools for reducing demand and is progressively implementing metering and charging |
Poor position to effectively manage future demand for water supply but has adopted District Water Supply Strategy 2007 which, if implemented, should improve the situation Currently using some tools for reducing demand including working with farmers, education, and introducing metering |
| Attracting and retaining skill base (capability |
Identified as a problem – hard to attract suitable staff | Identified as a problem – also making provision for training a problem | ||
| Expenditure on drinking water supply |
Water supply funded by a targeted rate with a fixed component and a variable component based on actual consumption May be difficult to raise more revenue through the limited rating base LTCCP budgets $1,114,000 over the period 2009-19 on capital expenditure |
Water supply funded by targeted rate LTCCP budgets $157,639,000 (inflated) over the period 2009-19 |
Water supply funded by targeted rates Affordability and funding of upgrades, relying on approval of government subsidies LTCCP budgets $51,326,977 over the period 2009-19 on capital expenditure |
Water supply to be funded by loans, with uniform annual charges and metered water rates (where properties are metered) covering the interest and principal over time LTCCP budgets $81,079,000 over the period 2009-19 on capital expenditure |
| Total annual drinking water supply rates and charges (2009/10) | $720,000 | $22,197,000 | $2,538,508 | $7,836,000 |
| Total annual drinking water supply production | 602,250m3 | 54,300,000m3 | 5,269,631m3 | 15,695,000m3 |
| Volumetric price of drinking water | $1.22 per m3 | $0.41 per m3 | $0.48 per m3 | $0.50 per m3 |
| Value of water supply assets (30 June 2009) |
$9,839,000 | $342,918,000 | $41,502,000 | $77,413,000 |
| Local authority | Tauranga City Council | Nelson City Council | Tasman District Council | Kapiti Coast District Council |
|---|---|---|---|---|
| Population served by each supply system (at March 2009) | Tauranga City (103,783) | Nelson City (43,000) | Collingwood (450) Dovedale (450) Eighty Eight Valley (200) Hamama Road (50) Hope/Brightwater (2000) Kaiteriteri (300) Motueka (1200) Murchison (680) Pohara (150) Redwood Valley (550) Richmond (10,500) Tapawera (400) Upper Takaka (50) Waimea Industrial/Mapua/ Ruby Bay (1680) Wakefield (1500) [Three of these – Redwood Valley, Eighty Eight Valley and Dovedale – are rural water supplies] |
Hautere/Te Horo (700) Otaki (5700) Paekakariki (1700) Paraparaumu/ Waikanae (31,900) |
| Average drinking water consumption in litres per person per day (lpd) | 198 (residential only) 270 (all users) |
180 (residential only) 500 (all users) |
250-375 for larger supplies 125-250 for smaller supplies |
Paraparaumu/Raumati – 404 Waikanae – 543 Hautere/Te Horo – (no data) Otaki – 763 Paekakariki – 450 |
| Other information | The port is a significant part of Tauranga's economy, while horticulture and agriculture are the main drivers of the Western Bay of Plenty's economy | Urban district – the main drivers of the regional economy are its horticulture, pastoral production, forestry, seafood, and tourism sectors | Semi-rural – fruit growing, farming, fishing, and forestry are the main economic contributors to the district's economy Viticulture and tourism are other important industries |
Rural-urban – changed from a series of holiday settlements and farming areas into a rapidly urbanised and popular district Kapiti is the fastest growing district in the Wellington region |
| Local authority | Opotiki District Council | Christchurch City Council | Central Otago District Council | South Taranaki District Council |
|---|---|---|---|---|
| Population served by each supply system (at March 2009) | Ohiwa (50) Opotiki (5100) Te Kaha (150) |
Akaroa (1350) Birdlings Flat (240) Christchurch Central (311,000) Duvauchelle (440) Little River (240) Lyttelton (3720) Pigeon Bay (50) Takamatua (280) Wainui (320) |
Alexandra (5000) Clyde (1000) Cromwell (3400) Lake Roxburgh Village (90) Naseby (400) Omakau/Ophir (400) Patearoa (60) Ranfurly (1000) Roxburgh (700) |
Cold Creek/Pihama (470) Eltham (2200) Hawera (9771) Inaha (490) Nukumaru (< 50) Opunake (1500) Patea (1400) Pope Rural Scheme/Riverlea (50) Pungarehu (< 60) Rahotu (120) Wai-inu Beach (300) Waimate West (4500) Waverley (950) Waverley Beach (300) [Five of these are rural water supplies] |
| Average drinking water consumption in litres per person per day (lpd) | 300 | 435 | Alexandra – 855 Cromwell – 605 Clyde – 991 Omakau/Ophir – 803 Naseby – 228 Ranfurly – 661 Patearoa – 1169 Roxburgh – 488 Lake Roxburgh Village – 875 |
408 (excluding farms) 888 (including farms) |
| Other information | Rural district – the economy is primarily driven by agriculture, including beef, dairy, forestry, and horticulture (kiwifruit) Economic growth is a priority area for the Council |
Urban district – water supply is used primarily for residential, commercial, and industrial uses | Rural district, with rural or primary industries providing the backbone of the economy | Rural – the economy is based on dairy farming, with the oil and gas sector and engineering support industries also important |
