Part 3: Detailed results of our survey
3.1
In this Part, we present the results of our survey on overall incidents of fraud in the public sector. It breaks down those results in terms of small (579 respondents), medium (585 respondents), and large (300 respondents) public entities.28 It also highlights the results from different types of public entity.29
Incidents of fraud in the public sector
3.2
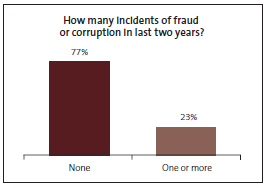
Nearly a quarter of respondents to our survey were aware of at least one incident of fraud or corruption in their public entity within the last two years.
3.3
Respondents from small public entities were less aware of an incident of fraud in the last two years (9%) compared with those from medium (21%) and large public entities (53%).
3.4
The types of public entity with the highest response rates for awareness of one or more incidents of fraud were State-owned enterprises, government departments, district health boards, airport companies, electricity lines businesses, licensing trusts or community trusts, and local authorities. Respondents from independent Crown entities, local government (other), and port companies were not aware of any incidents of fraud in the last two years.30 Figure 2 shows the percentage of respondents who were aware of one or more incidents of fraud in their public entity by entity type.
Figure 2
Percentage of respondents who were aware of one or more incidents of fraud in their public entity in the last two years
| One or more incidents of fraud | |
|---|---|
| Central government | 28.4% |
| Local government | 32.5% |
| Schools | 7.7% |
| Public sector overall | 22.5% |
3.5
The total dollar value of fraud in the last two years was mostly low, with 15% of respondents saying there was no monetary loss and 61% saying the dollar value was less than $10,000. Twenty-nine percent of respondents from large public entities said that they had incurred fraud losses of more than $10,000.
3.6
However, it is not always possible to accurately establish how much money has been lost in a fraud because sometimes the records and the investigation are incomplete.
3.7
Those who knew of an incident in the last two years were asked for details of the most recent incident.
3.8
Most of the most recent fraud incidents that respondents were aware of (80%) were committed by one internal person acting alone, typically at an operational staff level (46%) or administrative support level (22%). This finding was similar for small, medium, and large public entities and all entity types.
Types of fraud
3.9
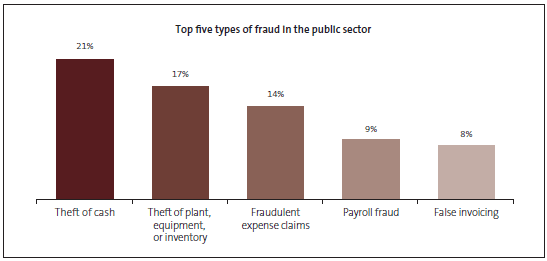
The most common type of fraud that respondents were aware of was theft of cash. This finding was similar for small, medium, and large public entities.
3.10
The most common types of fraud within small public entities were:
- theft of cash (21%);
- theft of plant, equipment, or inventory (20% combined); and
- fraudulent expense claims (19%).
3.11
The most frequent types of fraud within medium public entities were:
- theft of cash (21%);
- theft of plant, equipment, or inventory (21% combined);
- fraudulent expense claims (13%); and
- payroll fraud (13%).
3.12
The most frequent types of fraud within large public entities were:
- theft of cash (21%);
- theft of plant, equipment, or inventory (14% combined);
- fraudulent expense claims (13%);
- payroll fraud (11%); and
- conflicts of interest (such as making or receiving payments, or receiving undeclared gifts or services, to influence a decision or give preferential treatment) (11%).
3.13
Medium and large public entities were, by far, the most likely to experience payroll fraud. This could mean that it is an area of particular risk or that these public entities have more effective systems for detecting payroll fraud than smaller public entities.
3.14
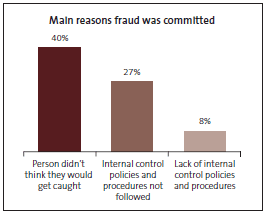
The most common reason why fraud was committed was that the perpetrator did not think they would get caught (40%). A quarter of respondents said that it was committed because internal control policies and procedures were not followed (27%). These two reasons were the same for small, medium, and large public entitles. These findings were similar across all the different types of public entity.
How was fraud detected?
3.15
Internal control systems were the most successful mechanism for detecting fraud, with 36% of respondents aware that frauds were detected in this way. Internal tip-offs (other than through a formal whistle-blowing system) led to 20% of the frauds detected. This finding was also the same for small, medium, and large public entities.
3.16
Prevention is the first line of defence against frauds for many public entities. Respondents from all the different entity types reported that internal control systems were a successful way of detecting fraud. Internal tip-offs (other than through a formal whistle-blowing system) were the most successful way of detecting fraud for airport companies, local authorities, Māori trust boards, and rural education activities programmes.
3.17
Respondents said that less than 1% of fraud incidents were detected by the external auditor. This low percentage is not surprising, because detecting fraud is neither the purpose nor the focus of an external audit.
Fraud controls
3.18
The pace of change in many work environments means that the process of ensuring that fraud controls align with the work environment should be an ongoing exercise.
3.19
Seventy-one percent of respondents said that their public entity reviews its fraud controls after a fraud had been committed. This could mean that some of the fraud controls are no longer effective, because systems and processes change over time. To work effectively, we recommend that fraud controls be reviewed annually or every two years.
Clear roles and responsibilities
3.20
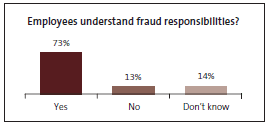
Although the culture modelled by the leaders of a public entity is critical, preventing fraud is not the responsibility of any one person. Overall, 73% of respondents said that other employees understood their responsibilities for preventing and detecting fraud. Respondents from small public entities were more confident (81%) compared with those from medium (68%) and large public entities (59%). Chief executives and administration staff had the highest confidence.
3.21
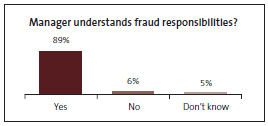
Respondents from all levels in the public sector (from the chief executive through to operational and administration staff) felt confident that managers understood their roles and responsibilities for preventing and detecting fraud (89%). Again, respondents from small public entities were more confident (93%) than those from medium (86%) and large (79%) public entities.
3.22
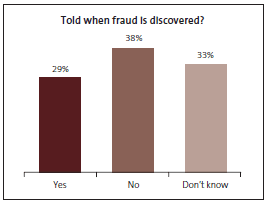
Senior managers understand well the importance of building an anti-fraud culture and regularly communicating with staff about incidents of fraud. However, only 29% of respondents said that managers told staff about incidents of fraud.
3.23
In our view, all employees need to understand their roles and responsibilities so that a culture receptive to discussing fraud can be supported and maintained.
Environment receptive to conversations about fraud
3.24
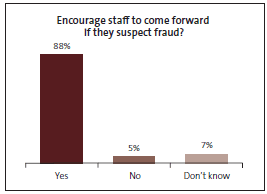
Most respondents (88%) worked in an environment where staff were encouraged to come forward if they suspected fraud had been committed. This finding was similar for all staff levels and for small, medium, and large public entities.
3.25
Most respondents (95%) also said that they could come forward knowing that their concerns would be taken seriously and without fear of retaliation. This finding was similar for all staff levels and for small, medium, and large public entities. Respondents from all the different types of public entity had a positive response rate between 84% and 100%.
Due diligence checks and pre-employment screening
3.26
Many frauds are committed through the use of fake suppliers or suppliers with a close personal relationship with an employee. Carrying out due diligence checks can help to mitigate the risk that suppliers can pose. Due diligence checks involve requesting references or credit checks. Other kinds of checks that can be done include:
- removing unused suppliers from the system; and
- regularly monitoring the changes to supplier details.
3.27
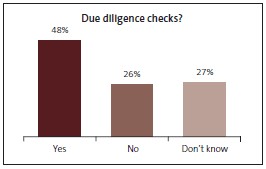
Only 48% of respondents said that due diligence checks were carried out. This finding was similar for small, medium, and large public entities. In our view, all public entities should be carrying out due diligence checks on new suppliers.
3.28
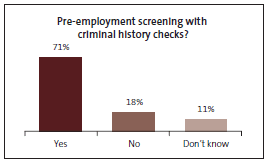
Most often, it is trusted employees who commit fraud. Trusting employees is important, but to trust without first ensuring that it is appropriate to do so exposes public entities to unnecessary risk. Overall, 71% of respondents said that new employees undergo pre-employment screening that includes a criminal history check. This finding was similar for small, medium, and large public entities.
Responding to risks
3.29
Most respondents (87%) were confident that their public entity would take proactive steps to reduce the risk of fraud if a fraud were discovered in their entity. This finding was similar for small, medium, and large public entities. The only types of public entity to have less than 85% of respondents agreeing with this statement were district health boards, airport companies, council-controlled organisations, and local government (other).
Credit card and expense claim fraud
3.30
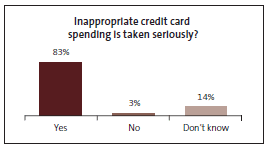
Most respondents (83%) were confident that their public entity would take inappropriate credit card spending seriously and discipline the person involved. This response rate was similar for small, medium, and large public entities. District health boards had the lowest response rate for the central government sector with 76%, and electricity lines businesses had the lowest for the local government sector with 68%.
3.31
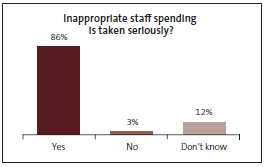
Respondents were more confident (86%) that inappropriate expense claims were taken seriously and resulted in disciplinary action. Small public entities (87%) were more confident than medium (81%) and large entities (78%).
3.32
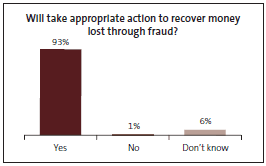
Most respondents (93%) were confident that their public entity would take action to recover any misappropriated funds. This response rate was similar in small, medium, and larger entities and throughout the public sector. Government departments had the lowest response rate for the central government sector with 84%. Port companies had the lowest for the local government sector with 50%.
3.33
A clear process to recover funds shows the seriousness with which fraud is taken. In our view, chief executives and senior managers need to send clear messages to staff that they will seek to recover any misappropriated funds.
Telling staff about incidents of fraud
3.34
Less than a third of respondents said that their senior managers told all staff about incidents of fraud. More senior managers from small public entities (39%) tell staff than in medium (24%) and large public entities (18%).
3.35
Communicating with staff is vital in raising awareness about fraud. Greater awareness makes it easier for staff to be vigilant, can confirm the entity's "zero tolerance" approach to fraud, and helps to maintain an environment where it is easy for staff to speak up about risks and raise any concerns.
Referring suspected fraud to the appropriate authorities
3.36
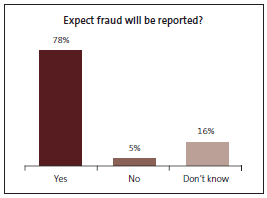
Most respondents (78%) expected that fraud would be reported to the appropriate authorities. Respondents from small public entities were more likely to think that the fraud would be reported (80%) than those from medium (75%) and large public entities (69%). The lowest positive response rate in the central government sector was government departments, where 70% of respondents said their public entity would report fraud to the relevant law enforcement agency. The highest was autonomous Crown entities and Māori trust boards (both with 91%).
3.37
In the local government sector, 50% of respondents from port companies and 63% of respondents from airport companies thought their public entity would report fraud to the relevant law enforcement agency.
3.38
The highest positive response rate came from respondents in local authorities and schools (both 81%).
3.39
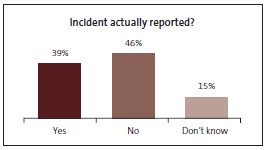
Almost half of the most recent incidents of fraud were not reported to the appropriate authorities. Large public entities were more likely to report fraud to the appropriate authority (43%) than medium (32%) and small (32%) public entities.
3.40
Many public entities are reluctant to bring criminal charges against their employees because of the time and costs of preparing a case and resolving matters in the courts, and a perception that fraud is a low priority for the New Zealand Police.
3.41
However, all public entities are expected to consider reporting fraud to the appropriate authorities. We encourage all public entities to do this.
3.42
Any decision made not to respond to fraud can erode staff confidence in the senior management team. It can create a perception that managers are not committed to preventing fraud and discourage staff from reporting their concerns. Taking no action when fraud is committed also increases the risk that an employee suspected of committing fraud could move to another public entity and continue their dishonest behaviour.
28: We have defined a small public entity as having fewer than 50 full-time equivalent employees (FTEs), a medium public entity as having between 51 and 500 FTEs, and a large public entity as having more than 500 FTEs.
29: Figures in the text and graphs have been rounded. See the Appendix for an explanation of how we grouped public entities into types. The detailed results by type of entity are on our website, www.oag.govt.nz/2012.
30: Local government (other) includes council-controlled organisations that are exempted under section 7 of the Local Government Act 2002 and "miscellaneous" public entities (which are mainly trusts that are public entities under the Public Audit Act 2001).
page top