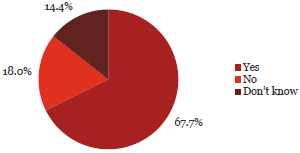
7. My organisation has designated a person who is responsible for fraud risks, including investigation.
Observation:

67.7% of respondents knew who was responsible for managing fraud risk including investigation in their organisations.
This was stronger among Chief Executives (73%), senior managers (72%) and line managers (66%). It was less known by administration and support staff (60%) and operational staff (50%).
What some respondents have said:
“We don't have a specific fraud policy or Manager tasked to prevent Fraud however it is a major component of numerous roles within our organisation”.
“The fraud policy was introduced in 2009. A Fraud Investigation Group, Chaired by the Assurance Advisor and consisting of members of the executive and HR Manager consider all allegations of suspected fraud and determine the appropriate course of action.”
“Since 2009 procurement practices have improved and greater attention is given to screening suppliers for conflicts of interests etc. Some staff, mainly front line, are screened for criminal records, but not all. And a gift register was introduced in 2010.”
| Yes | No | Don’t know | Total Count | ||||
|---|---|---|---|---|---|---|---|
| Chief Executive Officer/Managing Director/Principal | 281 | 73% | 91 | 24% | 11 | 3% | 383 |
| Member of the senior executive/leadership team or equivalent | 354 | 72% | 87 | 18% | 51 | 10% | 492 |
| Line manager (if not one of the above) | 145 | 66% | 27 | 12% | 49 | 22% | 221 |
| Administration/Support Services | 122 | 60% | 32 | 16% | 48 | 24% | 202 |
| Operational staff (e.g. Teacher, Analyst, Advisor, Technician, Officer, Engineer, Accountant) | 69 | 50% | 21 | 15% | 47 | 34% | 137 |
| Total | 971 | 68% | 258 | 18% | 206 | 14% | 1,435 |
| Yes | No | Don’t know | Total | ||||
|---|---|---|---|---|---|---|---|
| Central Government | |||||||
| Autonomous Crown Entities | 47 | 87% | 5 | 9% | 2 | 4% | 54 |
| Central Government - Other | 33 | 72% | 8 | 17% | 5 | 11% | 46 |
| Crown Agents or Companies | 67 | 77% | 10 | 11% | 10 | 11% | 87 |
| Crown Research Institutes | 26 | 68% | 6 | 16% | 6 | 16% | 38 |
| District Health Boards | 52 | 74% | 6 | 9% | 12 | 17% | 70 |
| Government Departments | 99 | 67% | 21 | 14% | 27 | 18% | 147 |
| Independent Crown Entities | 26 | 70% | 3 | 8% | 8 | 22% | 37 |
| Māori Trust Boards | 4 | 36% | 5 | 45% | 2 | 18% | 11 |
| Rural Education Activities Programmes | 5 | 45% | 3 | 27% | 3 | 27% | 11 |
| State-Owned Enterprises | 40 | 83% | 3 | 6% | 5 | 10% | 48 |
| Tertiary Education Institutions | 73 | 80% | 3 | 3% | 15 | 16% | 91 |
| Sub-Total | 472 | 74% | 73 | 11% | 95 | 15% | 640 |
| Yes | No | Don’t know | Total | ||||
|---|---|---|---|---|---|---|---|
| Local Government | |||||||
| Airports | 13 | 68% | 1 | 5% | 5 | 26% | 19 |
| Council Controlled Organisations or Council Controlled Trading Organisations | 50 | 66% | 17 | 22% | 9 | 12% | 76 |
| Energy Companies | 17 | 61% | 9 | 32% | 2 | 7% | 28 |
| Fish and Game Councils | 8 | 100% | 0 | 0% | 0 | 0% | 8 |
| Licensing and Community Trusts | 3 | 33% | 6 | 67% | 0 | 0% | 9 |
| Local Authorities | 107 | 63% | 34 | 20% | 28 | 17% | 169 |
| Local Government - Other | 2 | 18% | 9 | 82% | 0 | 0% | 11 |
| Port Companies | 2 | 67% | 1 | 33% | 0 | 0% | 3 |
| Sub-Total | 202 | 63% | 77 | 24% | 44 | 14% | 323 |
| Schools | 297 | 63% | 108 | 23% | 67 | 14% | 472 |
| Total | 971 | 68% | 258 | 18% | 206 | 14% | 1,435 |

