Indicator 1: Number and proportion of older persons
| Indicator is fully reported? |
Yes. |
| Type of indicator |  Basic demographic indicator Basic demographic indicator |
| Our findings |
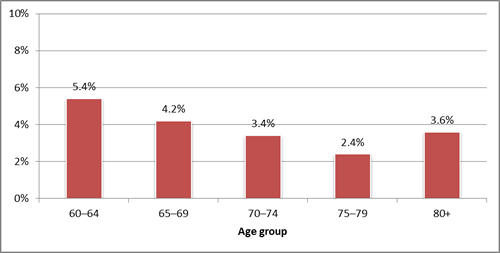
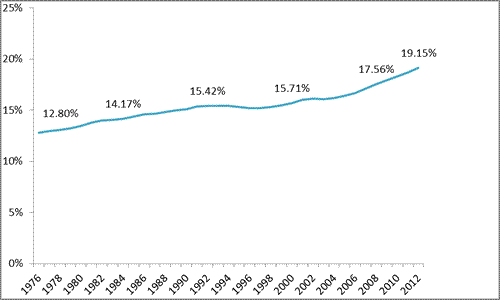
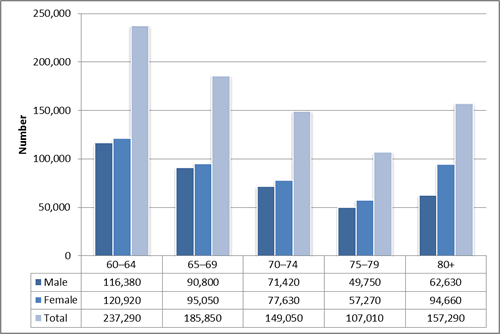
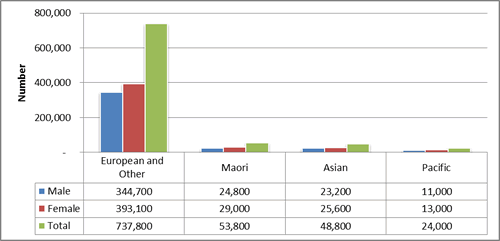
At 31 December 2011, the total population of people aged 60+ was estimated at 837,000. This represented 19% of the total population (see Figure 1). The proportion of the total population aged 60+ increased from 13% in 1976 to 19% in 2012 (see Figure 2). Figure 3 shows that there are more older women than men in each age group. Figure 4 shows that projections for 2012 indicate that 737,800 people (87%) in the 60+ population would identify with European or other ethnicity, 53,800 (6%) with Māori ethnicity, 48,800 (6%) with an Asian ethnicity, and 24,000 (3%) with a Pacific ethnicity. (People with more than one ethnicity are included in each ethnic population that they identify with. We rounded percentages to the nearest percent. In 2006, about 0.2% of the population aged 60+ identified with Middle Eastern, Latin American, and African ethnicities.) |
| How entities use the data | Data is published for general use and to make projections. |
| Entity responsible for this indicator | Statistics New Zealand |
Figure 1: Estimated resident population aged 60+ (proportion), at 31 December 2011

Source: OAG, using data from Figure 3. Data rounded to one decimal point.
Figure 2: Estimated proportion of people aged 65+ by living arrangement and ethnicity, 1976-2012

Source: Statistics New Zealand (2013), Demographic Trends: 2012, available from www.stats.govt.nz. Data rounded to two decimal points.
Figure 3: Estimated resident population aged 60+, at 31 December 2011

Source: Statistics New Zealand (2013). Demographic Trends: 2012, available from www.stats.govt.nz.
Figure 4: Projected resident population of people aged 60+, by ethnic group, at 30 June 2012

Source: Statistics New Zealand (2013), Table Builder: Projected Ethnic Population of New Zealand, by Age and Sex, 2006 (base) - 2026 Update, series 6 projection, available from www.stats.govt.nz.
Note: “European and other” includes "New Zealander", and excludes people identifying as Middle Eastern, Latin American, and African ethnicities.

