Indicator 24: Disability-free life expectancy
| Indicator is fully reported? | Yes |
| Type of indicator |  Outcome indicator Outcome indicator |
| Other relevant indicators | We report on independent life expectancy (ILE) at birth and age 65 (pensionable age) for men, women, and ethnicity for selected years. |
| Our findings |
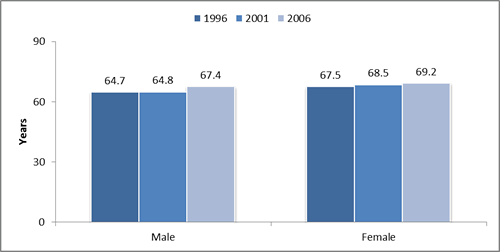
ILE is the number of years expected to be lived free of functional limitation and without needing assistance.[1] It is derived from bringing together life expectancy data[2] and disability survey data.[3] It has been used as the peak health indicator by the Ministry of Social Development and the Ministry of Health.[4] Figures 1 compares the years of ILE for men and women at birth for 1996, 2001, and 2006. It shows that:
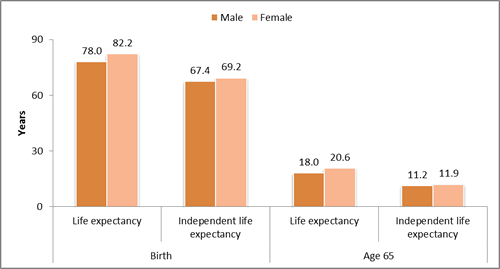
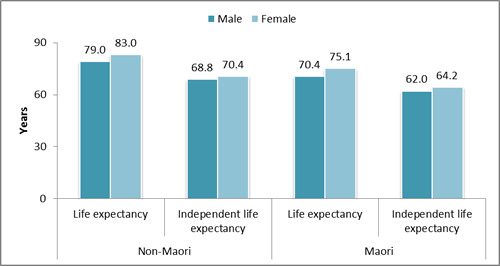
Figure 2 shows ILE for men and women compared to life expectancy, at birth and at age 65, in 2006. It shows that women were expected to live longer than men and have more years of ILE. Figure 3 compares the life expectancy and ILE for men and women at birth by ethnicity for 2006. It shows that non-Māori were expected to live longer than Māori and have more years of ILE. |
| How entities use the data |
The Ministry of Health and Statistics New Zealand have used existing data to discuss how to increase understanding of health expectancy indicators, standardise their calculation, and consider which health expectancy indicators should be used, reported, and their usefulness evaluated.[5] A suitable health expectancy indicator is planned to be elevated to Tier 1 status in the Official Statistic System from 2014/15.[6] |
| Entity responsible for this indicator |
|
Figure 1: Independent life expectancy for men and women at birth, 1996, 2001, and 2006

Source: Ministry of Health and Statistics New Zealand (2009), Longer life, better health? Trends in health expectancy in New Zealand 1996-2006, page 23, www.stats.govt.nz/browse_for_stats/health/life_expectancy/longer-life-better-health.aspx.
Figure 2: Life expectancy and independent life expectancy at birth and age 65, 2006

Source: Ministry of Health and Statistics New Zealand (2009), Longer life, better health? Trends in health expectancy in New Zealand 1996-2006, page 17, www.stats.govt.nz/browse_for_stats/health/life_expectancy/longer-life-better-health.aspx.
Figure 3: Life expectancy and independent life expectancy at birth by ethnicity, 2006

Source: Ministry of Health and Statistics New Zealand (2009), Longer life, better health? Trends in health expectancy in New Zealand 1996-2006, page 20, www.stats.govt.nz/browse_for_stats/health/life_expectancy/longer-life-better-health.aspx.
[1] Tobias, Martin and Smith, Conal (2008), Health Expectancy: Toward Tier 1 official statistic status, page 8, Ministry of Health and Statistics New Zealand, www.stats.govt.nz/browse_for_stats/health/life_expectancy/health-expectancy-nov08.aspx.
[2] See Madrid indicator 23.
[3] More information about the disability surveys is available from www.stats.govt.nz/browse_for_stats/health/disabilities.aspx.
[4] Ministry of Health and Statistics New Zealand (2009), Longer life, better health? Trends in health expectancy in New Zealand 1996-2006, page 6, www.stats.govt.nz/browse_for_stats/health/life_expectancy/longer-life-better-health.aspx
[5] Ministry of Health and Statistics New Zealand (2009), Longer life, better health? Trends in health expectancy in New Zealand 1996-2006, page 6, www.stats.govt.nz/browse_for_stats/health/life_expectancy/longer-life-better-health.aspx.

