Indicator 29: Disability rate
| Indicator is fully reported? | Yes. |
| Type of indicator |  Outcome indicator Outcome indicator |
| Other relevant indicators |
|
| Our findings |
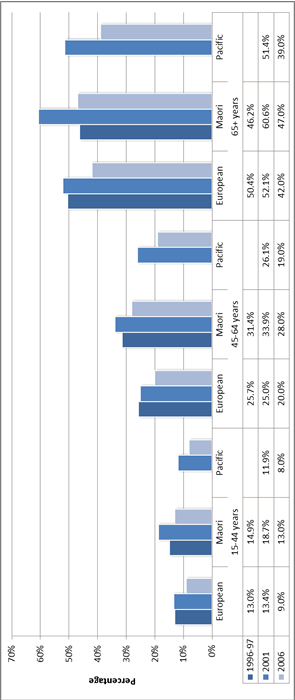
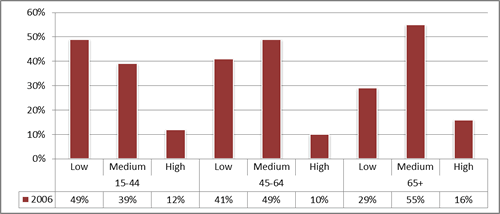
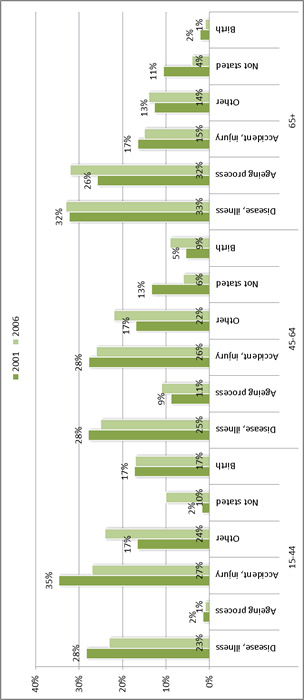
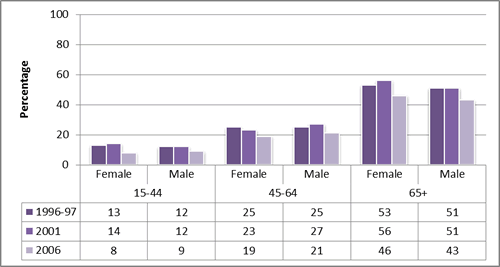
The New Zealand Disability Survey is highly regarded internationally and is run after each census.[1] The survey collects data about disability by age, sex, ethnicity, and a wide range of other variables – such as, where people with disabilities are living, marital status, severity of limitation, type of disability, and income.[2] Data tables from the 1996-97 and 2001 surveys are available on Statistics New Zealand’s website. Data from the 2006 survey can be obtained using an online tool. We collated data from the 1996-97, 2001, and 2006 surveys for people aged 15-44, 45-64, and 65+. We report data for three surveys where possible, and for 2001 and 2006 where data was not comparable with 1996-97. Figure 1 shows that, for people living in households, the proportion of disabled people increased with increasing age.[3] In almost all of the age groups, a higher proportion of Māori experienced disability than other ethnic groups. The first two surveys assessed the severity of people’s disability. This has been replaced by assessing the level of support that disabled people need. Figure 2 shows data for 2006. It shows that people's support needs increase as they get older. Seven out of every 10 disabled people aged 65+ had medium or high support needs. Figure 3 shows that the two main causes of impairment for peopled aged 65+ were disease/illness and the ageing process. For the two younger groups, the two main causes were disease/illness and accident/injury. Figure 4 shows that disability rates by age group are broadly similar for men and women. |
| How entities use the data |
Data from the NZ Disability Survey is provided for general use and to improve policy and the provision of services. Data from this survey is also used to report against the New Zealand Disability Strategy 2001 and the UN Convention on the Rights of Persons with Disabilities.[4] |
| Entity responsible for this indicator | Statistics New Zealand |
Figure 1: Disabled adults living in households as a proportion of all adults, by age group and ethnicity, 1996-97, 2001, and 2006

We calculated the rates for 1996-97 and 2001 using numbers given in the data tables published at www.stats.govt.nz/browse_for_stats/health/disabilities/more-disabilities-information.aspx. Statistics New Zealand gave us the data for 2006. We rounded the percentages to one decimal point. We excluded disability rates for Asian, Other, Not Specified, or Not Elsewhere Included because they were not comparable for the three surveys. This graph excludes people with disabilities who were living in residential care.
Figure 2: Level of support need for disabled adults living in households by age group, 2006

Statistics New Zealand gave us the data for 2006. This graph excludes people with disabilities who were living in residential care.
Figure 3: Main cause of impairment for disabled adults living in households by age group, 2001 and 2006

We calculated the rates for 2001 using numbers given in the data tables published at www.stats.govt.nz/browse_for_stats/health/disabilities/more-disabilities-information.aspx. Statistics New Zealand gave us the data for 2006. We rounded the rate to the nearest percentage point. We excluded data from 1996-97 because data for some causes was not comparable. This graph excludes people with disabilities who were living in residential care.
Figure 4: Disability rate for adults by age group and sex, 1996-97, 2001, and 2006

The numbers for 1996-97 and 2001 came from data tables published at www.stats.govt.nz/browse_for_stats/health/disabilities/more-disabilities-information.aspx. Statistics New Zealand gave us the data for 2006. This graph includes people living in households and residential care.
[1] Human Rights Commission and others (2012), Making disability rights real: Annual report of the Independent Monitoring Mechanism of the Convention on the Rights of Persons with Disabilities, page 6 and 76, www.hrc.co.nz/disabled-people/convention-on-the-rights-of-persons-with-disabilities/making-disability-rights-real.
[2] Information about the survey is available at www.stats.govt.nz/browse_for_stats/health/disabilities.aspx#aboutdisabilities.
[3] This does not include older people living in residential care, where most were 65+ and the disability rate was over 95%.

