Part 3: Financial performance of district health boards
3.1
In this Part, we describe:
- the 2014/15 financial results for each DHB, and the overall financial sustainability of DHBs;
- the monitoring of DHBs;
- our analysis of DHBs' financial statements from the last seven years to understand their financial health; and
- our consideration of the effect of DHBs' fixed costs of capital.
Financial results
3.2
Vote Health 2014/15 was the second largest Vote in the Government's Budget, with appropriations totalling $15.6 billion ($14.7 billion in 2013/14). The total budget for the provision of health services fully devolved to the DHBs for 2014/15 was $11.5 billion ($11.2 billion in 2013/14) as per the 2014/15 Supplementary Estimates of Appropriations. DHBs received about 2.3% additional funding from the Ministry of Health in 2014/15 (the additional funding in 2013/14 was a 3.5% increase.)
3.3
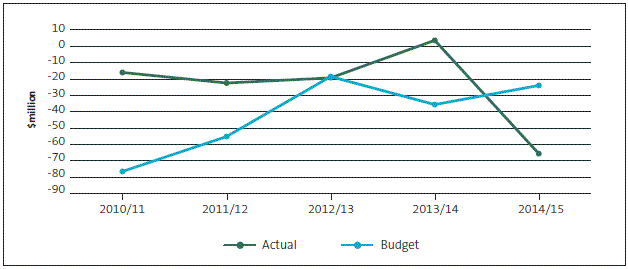
Figure 7 shows the aggregate financial results for the DHBs over the last five years, comparing the actual surplus/deficit with that budgeted for each year. The 2012/13 figure excludes insurance pay-outs to Canterbury DHB in that year of $294.7 million, as this was a one-off event that would have distorted the overall result.
Figure 7
Comparison of district health boards' budgeted and actual surplus/deficit (aggregated), 2010/11 to 2014/15
3.4
The financial performance of DHBs was relatively stable between 2010/11 and 2013/14, with actual aggregate results better than or close to budget in each year. This deteriorated significantly in 2014/15, when the aggregate result was a much higher deficit than budgeted. The main contributors to this deterioration were the results for Southern DHB and Canterbury DHB. The larger deficit in 2014/15 for Canterbury DHB is partly due to the Government's decision to fund the budgeted deficit through additional equity rather than as revenue as it had in 2014, enabling Canterbury DHB to break even that year.
3.5
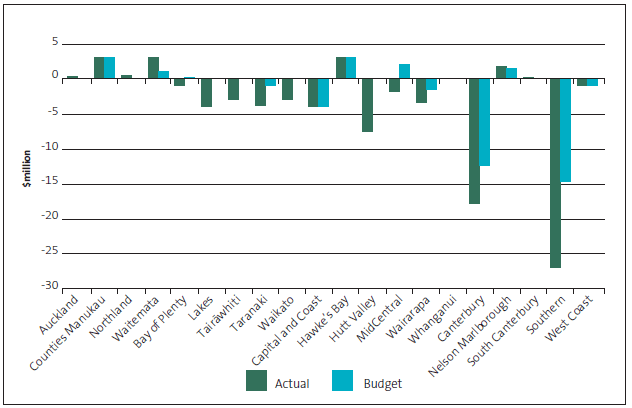
Figure 8 shows the budgeted and actual financial results for each of the DHBs for 2014/15.
Figure 8
Financial results for district health boards, 2014/15
3.6
Figure 8 shows some variability, but results were generally worse than budget. The two largest deficits were those of Southern DHB ($27.2 million) and Canterbury DHB ($17.9 million).
3.7
Financial sustainability remains an ongoing concern, given the ageing population, ongoing staff salary negotiations, and generally higher public expectations regarding service. DHBs are under pressure to deliver more during a period of constrained increases in funding.
3.8
DHBs reported an overall deficit of $65.6 million for 2014/15 against a budgeted deficit of $23.9 million. Appendix 3 sets out the financial results of each individual DHB for 2014/15.
3.9
DHBs are expected to make efficiencies through collaboration with other DHBs –for example, regionally and sub-regionally – and by using shared service agencies such as NZHP. They are also expected to increase service delivery in many areas – for example, to meet the national health targets.
3.10
The pressure on DHBs to achieve a break-even position creates continuing business and audit risks for many DHBs.
3.11
Although the deficits of some individual DHBs are decreasing compared with previous years, a number of DHBs remain under significant financial pressure. Having said this, we included an emphasis of matter paragraph relating to going-concern status in only one DHB's audit report. That was Southern DHB, which has a deteriorating financial position. Some other DHBs had received a letter of support from the Ministers of Health and Finance, which in some cases was a factor in our assessment of their going-concern status, but was not significant enough to require specific mention in the audit report.
Monitoring of district health boards
The Ministry grades each DHB according to the intensity of the "watch" on which it has placed the DHB. This is primarily (but not entirely) a reflection of the financial performance of the DHB. Figure 9 shows the Ministry's latest risk gradings of each DHB.
Figure 9
Ministry of Health's risk gradings of district health boards, April 2016
| Northern region | |
| Auckland | Standard Monitoring |
| Counties Manukau | Standard Monitoring |
| Northland | Standard Monitoring |
| Waitemata | Standard Monitoring |
| Midland region | |
| Bay of Plenty | Standard Monitoring |
| Lakes | Performance Watch |
| Tairāwhiti | Standard Monitoring |
| Taranaki | Performance Watch |
| Waikato | Performance Watch |
| Central region | |
| Capital and Coast | Intensive |
| Hawke's Bay | Standard Monitoring |
| Hutt Valley | Intensive |
| MidCentral | Performance Watch |
| Wairarapa | Intensive |
| Whanganui | Standard Monitoring |
| South Island region | |
| Canterbury | Single Event |
| Nelson Marlborough | Standard Monitoring |
| South Canterbury | Standard Monitoring |
| Southern | Intensive |
| West Coast | Intensive |
Source: Ministry of Health
3.13
Financial sustainability will continue to be an area of audit focus in 2015/16.
Financial structure of district health boards
3.14
In our last two health sector reports, for the results of the 2011/12 and 2012/13 audits, we reported on the financial health of DHBs using information from the audited financial statements. In both reports, we noted that DHBs were operating in a challenging environment. In our last report, we stated that the focus on delivering short-term results might limit the ability of DHBs to respond to unexpected events or exploit opportunities without recourse to the Crown.
3.15
Since publishing those two reports, we have seen serious financial difficulties experienced by Southern DHB and, to a lesser extent, by Canterbury DHB. Our recent report on DHBs' asset management also questioned how well DHB's asset management practices support future service delivery and financial decision-making.9
3.16
In this report, we again examine parent data10 in the audited financial statements of DHBs for the last seven years to find out how well the sector's financial structure supports the delivery of health services. By financial structure, we mean the way financial resources are planned for, organised, and allocated.
3.17
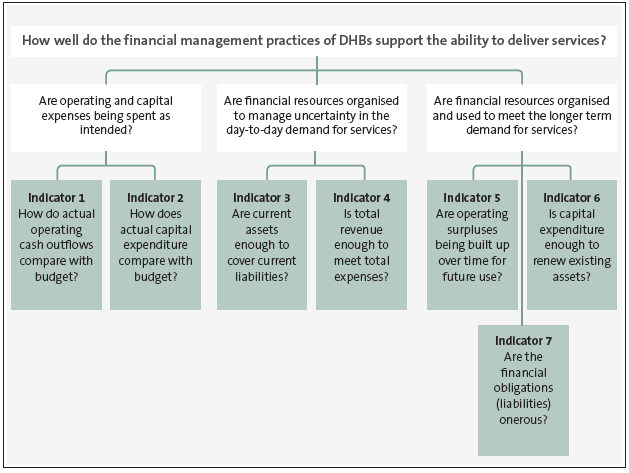
Although the sector's financial resources are only one part of the service delivery chain, if they are not well planned for, organised, and allocated, the ability to provide a resilient and enduring service could be constrained in times of uncertainty and change. Figure 10 sets out the questions we asked to inform our review.
Figure 10
Questions and criteria for reviewing DHBs' financial management practices
3.18
This approach is consistent with our previous health sector reports, except that Indicator 4 (whether total revenue covers total expenses) replaces an earlier indicator of ongoing (or fixed) costs in the review of DHBs' ability to manage uncertainty. The change reflects the importance of having an operating buffer in times of uncertainty, and the difficulty in assessing what costs are fixed, as a large proportion of DHB spending is contracted through other health service providers.
3.19
Our analysis for each indicator is summarised using graphs, which we present in Figures 12-18. Each dot represents one DHB for a particular year. We chose to present the results in this way to show how the DHBs move over time as a group, and whether the outliers show significantly different results. We can show this outlier effect more clearly when we present the results in this way.
3.20
The graphs cover the period from 2008/09 to 2014/15. In preparing our graphs, we specified ranges within which we consider it reasonable to expect entities to function. For example, Indicator 1 compares actual operating expenditure with budgeted operating expenditure. For this indicator, we have set less than plus or minus 5% as our "reasonable" range, and more than plus or minus 10% per cent as outside our reasonable range. Ratios that are between 5% and 10% are difficult to apportion as being either within or outside a reasonable range and are therefore uncertain. Figure 11 summarises these ranges for each indicator.
Figure 11
Target ranges for our review of the financial structure of district health boards
| Indicator | Outside a reasonable range | Uncertain (neither within nor outside) | Within a reasonable range |
|---|---|---|---|
| 1. Actual versus budget operating cash outflows | More than +/-10% | Between +/-5% and +/-10% | Less than +/-5% |
| 2. Actual versus budget capital expenditure | More than +/-20% | Between +/-10% and +/-20% | Less than +/-10% |
| 3. Current assets to current liabilities | Below 50% | Between 50% and 90% | Above 90% |
| 4. Net income to total revenue | Below 0% | Between 0% and 1% | Above 1%** |
| 5. Retained earnings to total assets | Below 0% | Between 0% and 10% | Above 10% |
| 6. Capital expenditure to depreciation* | Below 100% | Above 200% | Between 100% and 200% |
| 7. Total liabilities to total assets | Above 70% | Between 50% and 70% | Below 50% |
* Ideally, we should compare depreciation with renewals-related capital expenditure only, but this information is not available in the financial statements of DHBs.
** If net income to total revenue becomes too high, this may also be a sign of poor planning or control.
3.21
The ranges are based on general accounting relationships and might not always be appropriate for a particular DHB at a particular point in time. However, throughout the sector and over time, they provide an indication of management's focus on and control over the way financial resources are being planned for, organised, and allocated. For example:
- a high "Total liabilities to total assets" ratio (above 70%) suggests that management might need to spend a disproportionate amount of time managing these liabilities; and
- a "Net income to total revenue" ratio of less than 0% suggests that the annual expenses of DHBs were greater than the annual revenue they received. This position is not sustainable over time.
How well are the district health boards operating as planned?
3.22
Overall, the indicators suggest that the sector's ability to operate as planned is mixed.
3.23
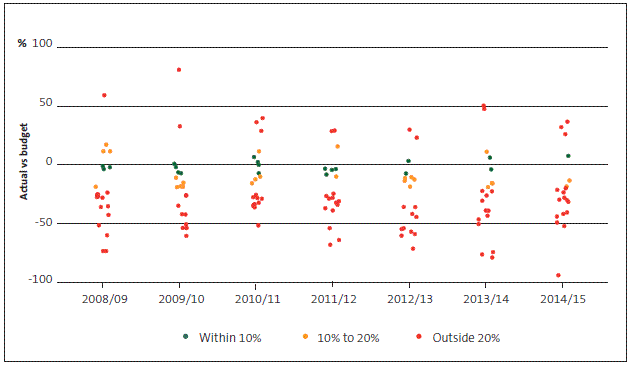
Figures 12 and 13 summarise how well the sector is operating as planned. Indicator 1 (actual versus budget operating cash outflows) shows how well operating expenditure is budgeted for and spent throughout the sector. Indicator 2 (actual versus budget capital expenditure) is similar to Indicator 1, but instead shows how well capital expenditure is budgeted for and spent throughout the sector. For both indicators, a ratio of 0% shows that DHBs spent exactly what they budgeted for in that year. This is a change to our previous health sector reports, where we showed budget as a proportion of actual expenditure. We made this change for consistency with our recent reports on other sectors, and because it enables us to show very low expenditure against budget, as can be seen particularly in Figure 13.
Figure 12
How district health boards' actual operating cash outflows compare with budget, 2008/09 to 2014/15
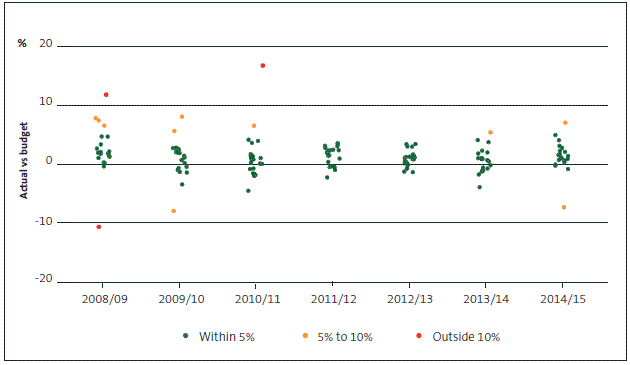
Figure 13
How district health boards' actual capital expenditure compares with budget, 2008/09 to 2014/15
3.24
As we have found in our previous health sector reports, DHBs are generally good at budgeting their operating expenditure but consistently under-spend on (or over-budget for) their capital expenditure programme. In 2014/15, there were two relatively large under-spending (operating and capital) outliers, both at West Coast DHB and both relating to the hospital redevelopment in Greymouth, which did not go ahead as expected during 2015.
3.25
In 2014/15, Counties Manukau DHB reportedly over-spent its capital budget, spending about $16 million more than expected on property, plant, and equipment and intangible assets. In the DHB's financial statements, this line item also included sales of assets, which are normally disclosed separately but in this case offset (reduced) the reported budgeted capital expenditure line. These sales mainly related to a potential sale of land that had been budgeted for, and reporting a separate budgeted number for asset sales would have been commercially unwise. The year-end variance was because the sale of this land did not occur during 2014/15 because the necessary clearances could not be obtained.
How well can district health boards manage uncertainty?
3.26
Overall, the indicators relating to managing uncertainty suggest that DHBs' resilience has declined slightly in the last two years.
3.27
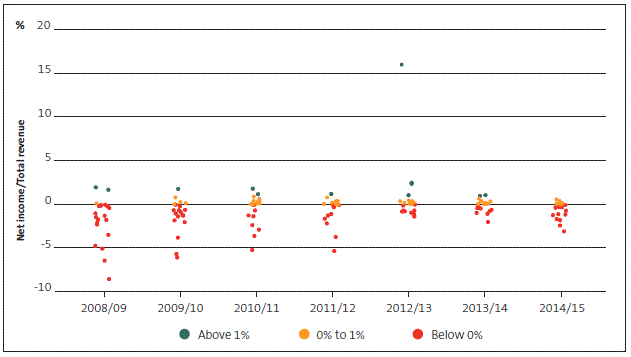
Figures 14 and 15 summarise DHBs' ability to manage uncertainty. Indicator 3 (current assets to current liabilities) shows whether current assets (such as cash, or accounts receivable) are enough to cover current liabilities (such as accounts payable, or current portion of debt). A ratio of less than 90% means it may be difficult for current assets to cover current liabilities. Indicator 4 (net income to total revenue)11 shows whether annual revenue is sufficient to cover annual expenses. A ratio of less than 0% means that annual revenue was not sufficient to cover annual expenses.
Figure 14
District health boards' current assets to current liabilities range, 2008/09 to 2014/15
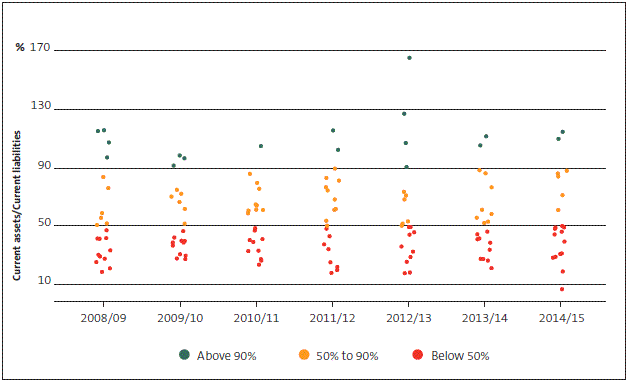
Figure 15
District health boards' net income to total revenue range, 2008/09 to 2014/15
3.28
The ability of the sector to cover its current liabilities with current assets has declined slightly over the last two years, and management of working capital remains an area of focus for most DHBs.
3.29
In 2014/15, Tairāwhiti DHB's current assets could cover only about 7% of its current liabilities. The low current asset position arose because of an unexpected cash flow deficit, which was financed with a short-term loan through HBL.
3.30
From 2008/09 to 2012/13, DHBs' overall net surplus/deficit steadily improved, but in the last two years, DHBs have largely moved back into deficit again.
3.31
In 2014/15, 13 of the 20 DHBs had net deficits for the year. In the last three years, Southern DHB has had the largest deficit in the sector – in 2014/15 this was 3.1% of its total revenue. The large net surplus outlier in 2012/13 was the result of a one-off insurance receipt by Canterbury DHB.
How well can district health boards invest for the future?
3.32
Overall, these indicators suggest that DHBs' ability to invest for the future continues to be limited (without recourse to the Crown).
3.33
Figures 16-18 summarise how well DHBs are able to invest for the future. Indicator 5 (retained earnings to total assets) shows the accumulated surpluses or deficits that the DHBs have incurred over time. A ratio of less than 0% suggests that no savings are available for future projects or programmes.
3.34
Indicator 6 (capital expenditure to depreciation) shows whether the level of capital expenditure matches the estimated consumption of, or the cost of using up, assets (that is, depreciation). When capital expenditure is less than depreciation over time, this can suggest insufficient spending on the renewal or replacement of existing assets. When capital expenditure is more than depreciation over time, this can reflect large new capital expenditure programmes. When it is considerably more, this is more uncertain and could also reflect limited long-term planning.
3.35
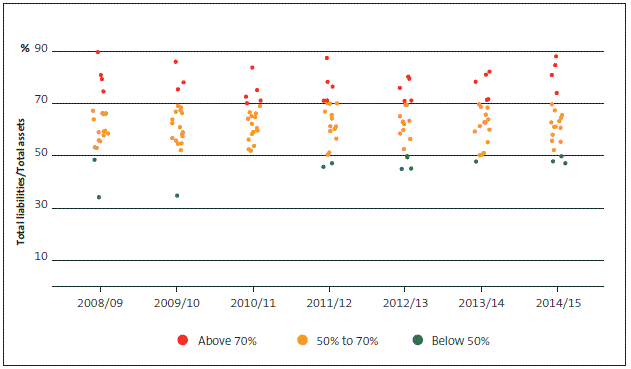
Indicator 7 (total liabilities to total assets) shows the level of liabilities DHBs are exposed to. A ratio of more than 70% means that management might need to spend a disproportionate time managing liabilities.
Figure 16
District health boards' retained earnings to total assets range, 2008/09 to 2014/15
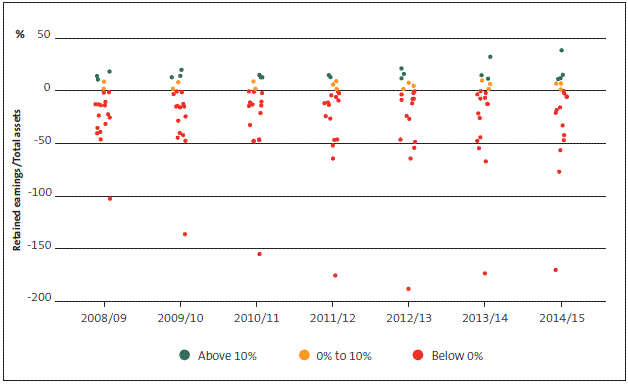
Figure 17
District health boards' capital expenditure to depreciation range, 2008/09 to 2014/15
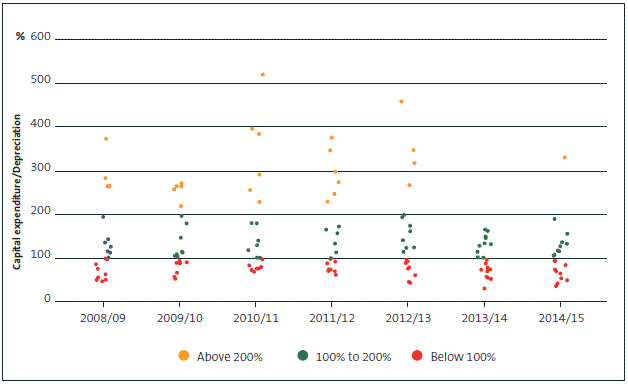
Figure 18
District health boards' total liabilities to total assets range, 2008/09 to 2014/15
3.36
The proportions of DHBs' retained earnings and liabilities have not changed materially since our previous health sector report. Most DHBs continue to fall outside what we would consider a reasonable range. We show that the magnitude and volatility of capital expenditure relative to depreciation is quite high for many DHBs from 2008/09 to 2012/13. For example, for each year from 2008/09 to 2011/12, at least five DHBs had capital expenditure levels that were more than 200% of depreciation. For 2013/14 and 2014/15, the indicator has stabilised but has also fallen largely outside of what we would consider a reasonable range.
3.37
Every year since 2008/09, Wairarapa DHB has had the highest proportion of liabilities compared with assets among DHBs, most of which are long-term loans from the Crown. Every year since 2008/09, West Coast DHB has had the lowest proportion of retained earnings to assets in the sector.
Managing fixed costs of funding
3.38
There are two fixed costs that DHBs must pay to Government for the use of funds provided by the Government. The first is a capital charge levied on the Crown's investment (that is, DHB equity or total assets less total liabilities) in each DHB at a rate of 8% per annum. The second is the interest charged on loans provided by the Government, including the refinancing of private sector debt in the early 2000s. The interest rate reflects New Zealand Government Bond rates, which vary. In 2015 it was about 3%.
3.39
For DHBs, the presumption is that any additional capital charges associated with new Crown funding or any operating surpluses will be funded from DHBs' existing baselines. Additional funding is automatic for increases associated with rate changes, revaluations, and accounting policy changes.
3.40
The Treasury states that charging for the use of Crown funding can be an effective tool to improve capital management and transparency.12 However, a review of various reports and commentaries suggest that the effectiveness of charging for Crown capital remains uncertain13 and we are unaware of any published review of the effectiveness of Crown-based debt funding of DHBs.
3.41
Our observations and commentary below is provided to encourage more debate about how the charging for Crown funding is affecting the financial and asset management practices of DHBs. It is not a full and detailed review of the capital charge regime or the use of Crown-based debt funding.
3.42
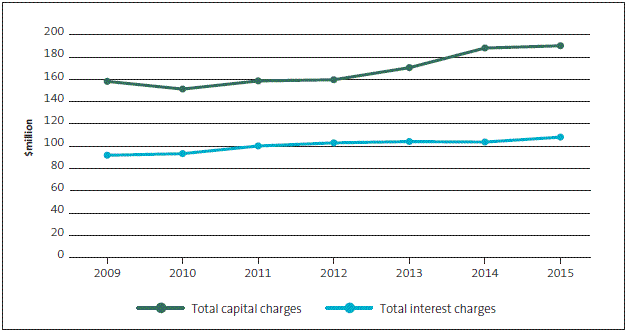
Figure 19 shows how much the DHBs paid the Government in capital charges and interest from 2008/09 to 2014/15.
Figure 19
District health boards' annual costs of capital (capital charge and interest payments), 2008/09 to 2014/15
3.43
Over this period, DHBs' annual interest payments have increased by about $16 million (on average about 3% each year). The annual capital charge has increased by about $32 million (on average about 3.5% each year over this same period).
3.44
Compared to the total amount of debt and equity of all DHBs, the overall annual cost of funding has reduced from about 7% (in 2008/09) to about 6.1% (in 2014/15). This reduction mainly reflects:
- the greater use of debt funding (instead of the more expensive equity funding) to finance investments in DHB capital assets; and
- a fall in the interest rate charged on that debt. The 10-year Government Bond rate reduced from about 5% (in 2008/09) to about 3% (in 2014/15).
3.45
In 2014/15, the largest costs of funding paid were by Auckland DHB (about $56 million) and the smallest by West Coast DHB (about $1.5 million).
Are the objectives aligning with practice?
3.46
The capital charge regime was first introduced into central government in the early 1990s as one part of a wider policy to emulate market forces within government.14
3.47
The objectives for applying a capital charge are to ensure that "... prices for goods and services produced by government departments reflect full production costs; allows comparison of the costs of output production with those of other producers (whether in the public or private sector); and creates an incentive for departments to make proper use of working capital and to dispose of surplus fixed assets."15
3.48
The use of debt financing by the DHBs was seen as complementing the Crown's equity support. Much of it arose from the Crown taking over health sector debt from the private sector from the early 2000s.16
3.49
A 1998 article on the effects of capital charges on capital expenditure decisions in core government concluded that "great difficulties arise in applying a system of real capital charges within the core government".17 These difficulties included:
- imperfect information about the quantity and quality of each output and whether an efficient production cost can be calculated;
- the relatively fixed and consistent nature of the capital charge in an environment of uncertainty;
- conflict between two different approaches to managing entities' balance sheets in a decentralised context– a capital charge regime (a price-signalling approach) and ongoing centralised capital rationing (a quantity-rationing approach); and
- the potential bias of entities towards projects that improve cost efficiency, which helps offset the capital charge, rather than those that improve the quality of services, which does not.
3.50
The main potential benefit of the capital charge to the financial management of DHBs is to support better balance sheet management. However, where the capital charge is largely fully funded, the incentive to support better balance sheet management is limited. Furthermore, in those cases where the capital charge is not fully funded, the ability to adjust net assets in response to changing capital charges is also limited because DHBs have little surplus assets to make a capital repayment (such as cash) and their larger capital assets (such as hospital buildings or clinical equipment) cannot be easily reduced in size or value.
What is happening in other countries?
3.51
We understand that, in the United Kingdom, capital charging still applies in the National Health Service18 but that it was removed from departments' budgets and accounts in 2009/10 because "... although the cost of capital charge was an important step when first introduced, other incentives … have now become more significant in promoting improved asset management."19
3.52
In Australia (at federal and state levels), the capital charge was largely discontinued over the period from 2003 to 2007. The Western Australia Government's Department of Treasury and Finance (DTF) noted in 2006 that the capital user charge (CUC) "... has proved a difficult concept to apply in the public sector, as evidenced by the removal of the CUC by all other Australian jurisdictions except Victoria … and … the charge has not led to noticeable improvements in the asset management practices of agencies. The charge has also proved to be administratively burdensome from both an agency and DTF perspective."20
3.53
Western Australia's reasons for discontinuing its capital charge regime are similar to the reasons given for discontinuing the scheme at the Commonwealth and other state government levels.
3.54
In 2006, the Western Australia Office of the Auditor General also noted that the capital user charge "... increased the risk of agencies manipulating their cash balances to minimise their exposure to this charge."21
What are we observing in New Zealand?
3.55
It is clear that DHBs devote considerable time to managing the implications of the capital charge on Crown equity and interest costs on Crown loans. For example:
- In 2005, Wairarapa DHB originally budgeted for a Crown equity drawdown of $3.9 million to fund the Wairarapa Hospital redevelopment. However, in its annual report, the DHB noted this was not required as the DHB was able to draw down debt at a lower interest rate than the capital charge rate at the time.22
- The 2010/11-2012/13 Statement of Intent for Taranaki DHB said, "… expenditure ($1.44M towards capital charge and depreciation) incidental to the revaluation of assets … carried out on 30 June 2008 continues to be charged against the hospital provider. This extraordinary expenditure has had a material impact on [Taranaki DHB's] financial and cash positions."23
- PricewaterhouseCoopers noted in its 2015 financial review of Canterbury DHB that the DHB avoided an increase in capital charges by transferring earthquake insurance proceeds to the Ministry and repaying equity from its reserves as a contribution to a particular project rebuild.24
- In Auckland DHB's Health Improvement Plan 2006 to 2010, the DHB sought to change its existing loan financing arrangements in a way that would "have the effect of delaying and reducing the requirement for equity injections from the Crown and consequently reduce capital charges".25
3.56
Various reviews also suggest that DHBs, particularly those with large capital investment programmes, face added financial management pressures because of (among other things) capital charges and interest costs.26
3.57
We have also seen a bias towards funding projects with Crown loans rather than using DHB equity. This is because, in the current environment, the interest cost (when using debt) is significantly lower than the capital charge (when using equity).
3.58
Whether the time spent on managing these costs (including the Treasury's time in administering the capital charge regime) could be better spent elsewhere would be an important part of any future review of these Crown costs of funding.
Are these costs of funding increasingly onerous?
3.59
There have been various accounts over the years of DHBs' experiencing difficulty managing interest and capital charges, and in our recent work on DHB asset management we heard from commentators that the capital charge was making investment decisions increasingly challenging. PricewaterhouseCoopers' financial review report for the Ministry of Health on Canterbury DHB also noted regarding "deficit drivers" that "a significant movement in depreciation and future capital charges over the next 5 years as the rebuild or new assets are transferred onto [Canterbury DHB's] books has a very material effect."27
3.60
To understand whether these costs of funding could be affecting DHBs, we looked at whether they had increased or decreased in the last seven years, as a proportion of DHB debt and equity, and revenue.
3.61
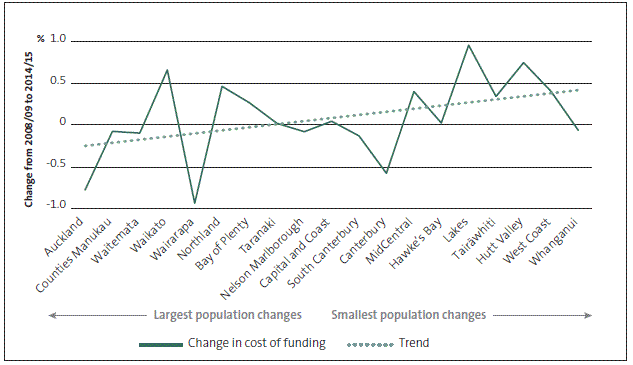
In the last seven years, the sector had seen a small reduction in these costs of funding relative to total debt and equity, and little change compared to revenue. However, when DHBs are ordered by how fast their populations have grown from 2008/09 to 2014/15 (although there was some variability), our findings suggest that:
- many DHBs in faster-growing areas had lower growth (or declines) in their costs of funding relative to debt and equity, or revenue; and
- many DHBs in slower-growing areas had higher growth in their costs of funding relative to debt and equity, or revenue.
3.62
Figures 20 and 21 show these costs of funding across DHBs.
Figure 20
Changes in district health boards' costs of funding as a proportion of total debt and equity, 2008/09 to 2014/15
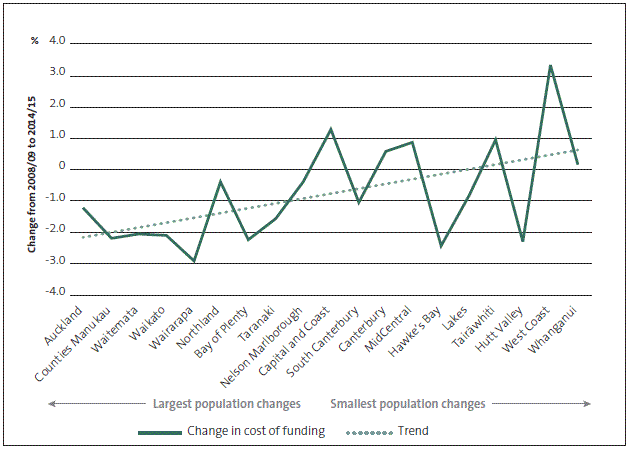
Note: We excluded Southern, Southland, and Otago DHBs from this analysis because Southland and Otago DHBs were merged into Southern DHB in 2010.
Figure 21
Changes in district health boards' costs of funding as a proportion of revenue, 2008/09 to 2014/15
Note: We excluded Southern, Southland, and Otago DHBs from this analysis because Southland and Otago DHBs were merged into Southern DHB in 2010.
Summary
3.63
The sector's fixed costs of funding have increased significantly since 2008/09 – particularly the capital charge. Although at a sector level, this growth is largely in line with the growth in DHB debt and equity, and revenue. It also appears that DHBs in slower-growing areas may be experiencing greater increases in the costs of funding when compared to DHBs in faster-growing areas.
3.64
Although interest on debt and the capital charge regime focuses management on the costs of the funds they use, the effectiveness of these fixed charges on capital asset decision-making remains uncertain. It would appear that, in some circumstances, considerable time is being spent on managing these fixed charges and possibly on administering the capital charge regime.
3.65
Overall, it isn't clear what the capital charge regime is achieving in the health sector. It appears to be giving DHBs an incentive to use debt funding rather than equity funding due to the higher capital charge rate. In the absence of DHBs being able to generate operating surpluses, they will need to continue to take on debt in order to fund their operating and capital needs.
3.66
There is also the possibility that changes in regional demographics are making these fixed charges increasingly onerous for DHBs in slower-growing areas, and that this may be affecting their future financial sustainability.
9: District health boards' response to asset management requirements since 2009, available at www.oag.govt.nz.
10: In a few instances, where no parent data is available, we use group data.
11: Net income is calculated as revenue less expenses and is before comprehensive income (which includes revaluation gains and losses).
12: See the Treasury's report T2010/1569 Outstanding issues with capital charge, page 9.
13: For example, see the Treasury (2006), Capital Asset Management Review, pages 23 and 62; State Services Commission (2010), Charging for Capital, available at www.ssc.govt.nz; Rose Anne MacLeod (2010), "Charge Down", available at www.gaaaccounting.com; and Office of the Auditor-General (1995), Third Report of the Controller and Auditor-General, pages 104-105.
14: See Marc Robinson, "Capital charges and capital expenditure decisions in core government", Journal of Public Budgeting, Accounting and Financial Management, 10(3), 354-374 (Fall 1998), page 356.
15: See Treasury Instructions 2014, page 35.
16: See Hon Annette King, Memorandum to Cabinet Health and Social Policy Committee 1 August 2000, "District health Board Investment and Balance Sheet Management: Further work"; and Crown Health Financing Agency Annual Report 2005, page 2. (The Crown Health Financing Agency was tasked with refinancing private debt.)
17: See Marc Robinson, "Capital charges and capital expenditure decisions in core government", Journal of Public Budgeting, Accounting and Financial Management, 10(3), 354-374 (Fall 1998), pages 361 and 364-369.
18: See the National Audit Office report The financial sustainability of NHS bodies, November 2014, pages 37-38.
19: HM Treasury March 2009 "Alignment (Clear line of sight) project", page 43.
20: Victoria State Government's Department of Treasury and Finance, Discussion Paper, Replacement of the Financial Administration and Audit Act by the Financial Management Act and the Auditor General Act, November 2005, page 9; and Department of Treasury and Finance, provision of additional information, 17 February 2006, page 11. (excerpts taken from Department of Treasury and Finance to the Public Accounts Committee Report 3, 2006).
21: Submission No 2a from Office of the Auditor General, 20 February 2006, page 4.
22: Wairarapa DHB, Well Wairarapa: Annual Report 2005, page 16.
23: Taranaki District Health Board, Statement of Intent 2010/11–2012/13, page 53.
24: See PricewaterhouseCoopers (2015), Canterbury District Health Board: Stage One Financial Review, page 26.
25: Auckland District Health Board (2006), Health Improvement Plan 2006 to 2010, page 56.
26: See PricewaterhouseCoopers (2015); Crown Health Financing Agency (July 2009), DHB Financial Sustainability, page 5; and Office of the Auditor-General (June 2015), Briefing to the Health Committee: Vote Health, paragraph 2.2.
27: See PricewaterhouseCoopers (2015), Canterbury District Health Board: Stage One Financial Review, page 7.

